Sunbase · Spatial engineering
Solar CAD Studio
An enterprise web CAD workspace that unifies satellite imagery, LiDAR, roof vectorization, sun simulation, and production modeling into one guided design flow.
Overview
Solar CAD Studio is an enterprise web CAD application that brings satellite imagery, LiDAR mesh rendering, roof-edge vectorization, sun-position simulation, and production modeling into one spatial workspace. I led product design and design engineering across a 14-week cycle of discovery, CAD architecture, and beta testing, covering spatial UI architecture, 3D canvas ergonomics, a parametric design system, and engineering workflows for solar designers, estimators, project managers, and roofing inspectors.
Impact
Legacy solar tools split the job across satellite maps, CAD software, shading calculators, trajectory charts, and proposal spreadsheets. Unifying them cut design-cycle time by 65% through guided setup, automated roof calculations, and panel placement. Accuracy improved through 3D height offsets, mesh controls, and sun-position simulation, and production reports, shade analysis, roofing reports, and CAD exports made the proposal-to-permit handoff immediate.
- Design-cycle time
- 65% shorter
- Exports for an immediate proposal-to-permit handoff
- Permit-ready
The problem
Traditional CAD tools demand training and slow down sales estimators. Inaccurate roof, tree, or obstruction data overestimates production and leads to installation disputes, and generic solar software struggles with commercial canopies and mounting. Without seasonal sun simulation, teams miss time-of-day and winter shading risks.
Research & direction
Contextual observation with 15 solar designers and site auditors produced three design constraints. Guided steps prevent missing structural inputs such as setbacks, roof pitch, and stringing data. Spatial modes (LiDAR, irradiance, shade, edges, efficiency, stringing) must stay one click away on a persistent toolbar. And parametric editing has to be non-destructive: changing a slope or obstruction height should recalculate panels, stringing, and production without resetting the design. The resulting direction was a guided spatial environment: a seven-step workflow, a central WebGL canvas, and inspectors that respond to whatever is selected.
Design decisions
The studio is a tri-pane workspace. A guided drawer holds setup, workflow steps, layers, and tutorials; the canvas holds imagery, LiDAR, vectors, roofs, and panels; and an inspector holds parameters, results, sun trajectory, and export. Projects route by type (Residential, Industrial, Canopy, Roofing), roofs are created by AI detection, tracing, flat or pitched faces, or dormers, and every parameter stays editable. Production is calculated continuously (offset, annual kWh, system size, shade loss) and exports to images, PDFs, proposals, roofing reports, or DXF.
Visual language
A Deep Slate workspace suits long engineering sessions, with Space Grotesk for headings and Plus Jakarta Sans for supporting text. A fixed vector legend (blue rakes, magenta ridges, orange hips, cyan eaves) classifies structure consistently. The spatial toolbar stays pinned to the canvas, and a layer hierarchy with visibility and lock controls keeps roofs, obstructions, trees, and arrays manageable.
Key screens
The walkthrough follows a designer's path: setting up a site, modeling the roof, configuring an array, aligning LiDAR, simulating sun, pruning weak panels, and checking the system before export.
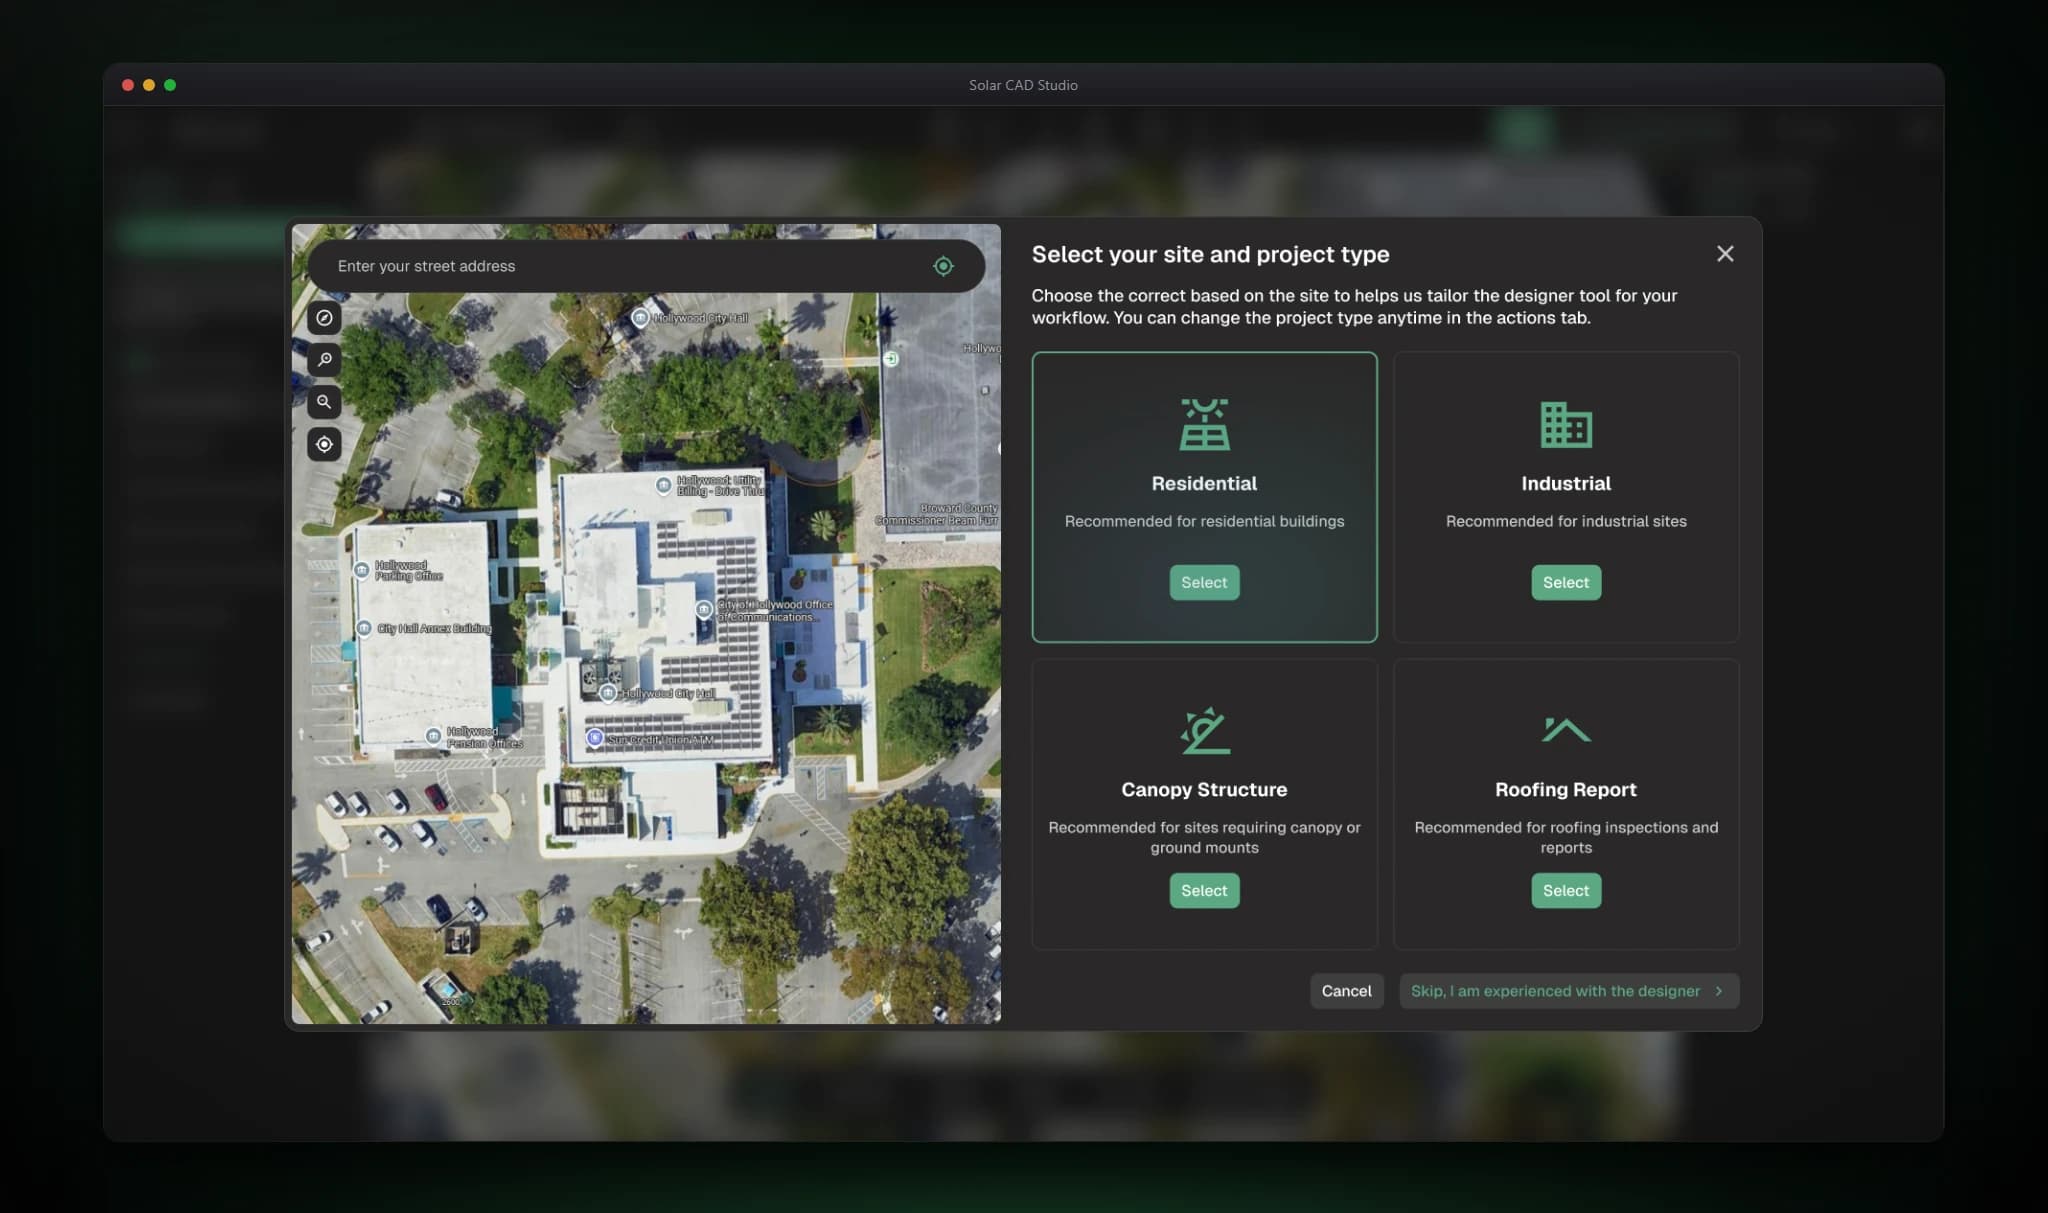
Start from an address and the right project type.
- The screen
- A dialog over the map pairs an address field with four project types (Residential, Industrial, Canopy Structure, Roofing Report), each with an icon, a one-line recommendation, and a Select action. Cancel and a "Skip, I am experienced with the designer" link sit below; the type can be changed later.
- The problem
- CAD tools carry a steep learning curve, and designs go wrong when structural inputs are missed at the start. Residential roofs, industrial sites, canopies, and roofing reports also need different workflows, not one generic one.
- Design decisions
- Choosing the type first routes the rest of the workflow, so later steps only offer what applies. Cards with plain-language recommendations let a new user decide without training, while the skip link respects experienced designers. The map stays visible behind the dialog to keep the site as the starting point, and the choice is reversible so it doesn't feel like a commitment.
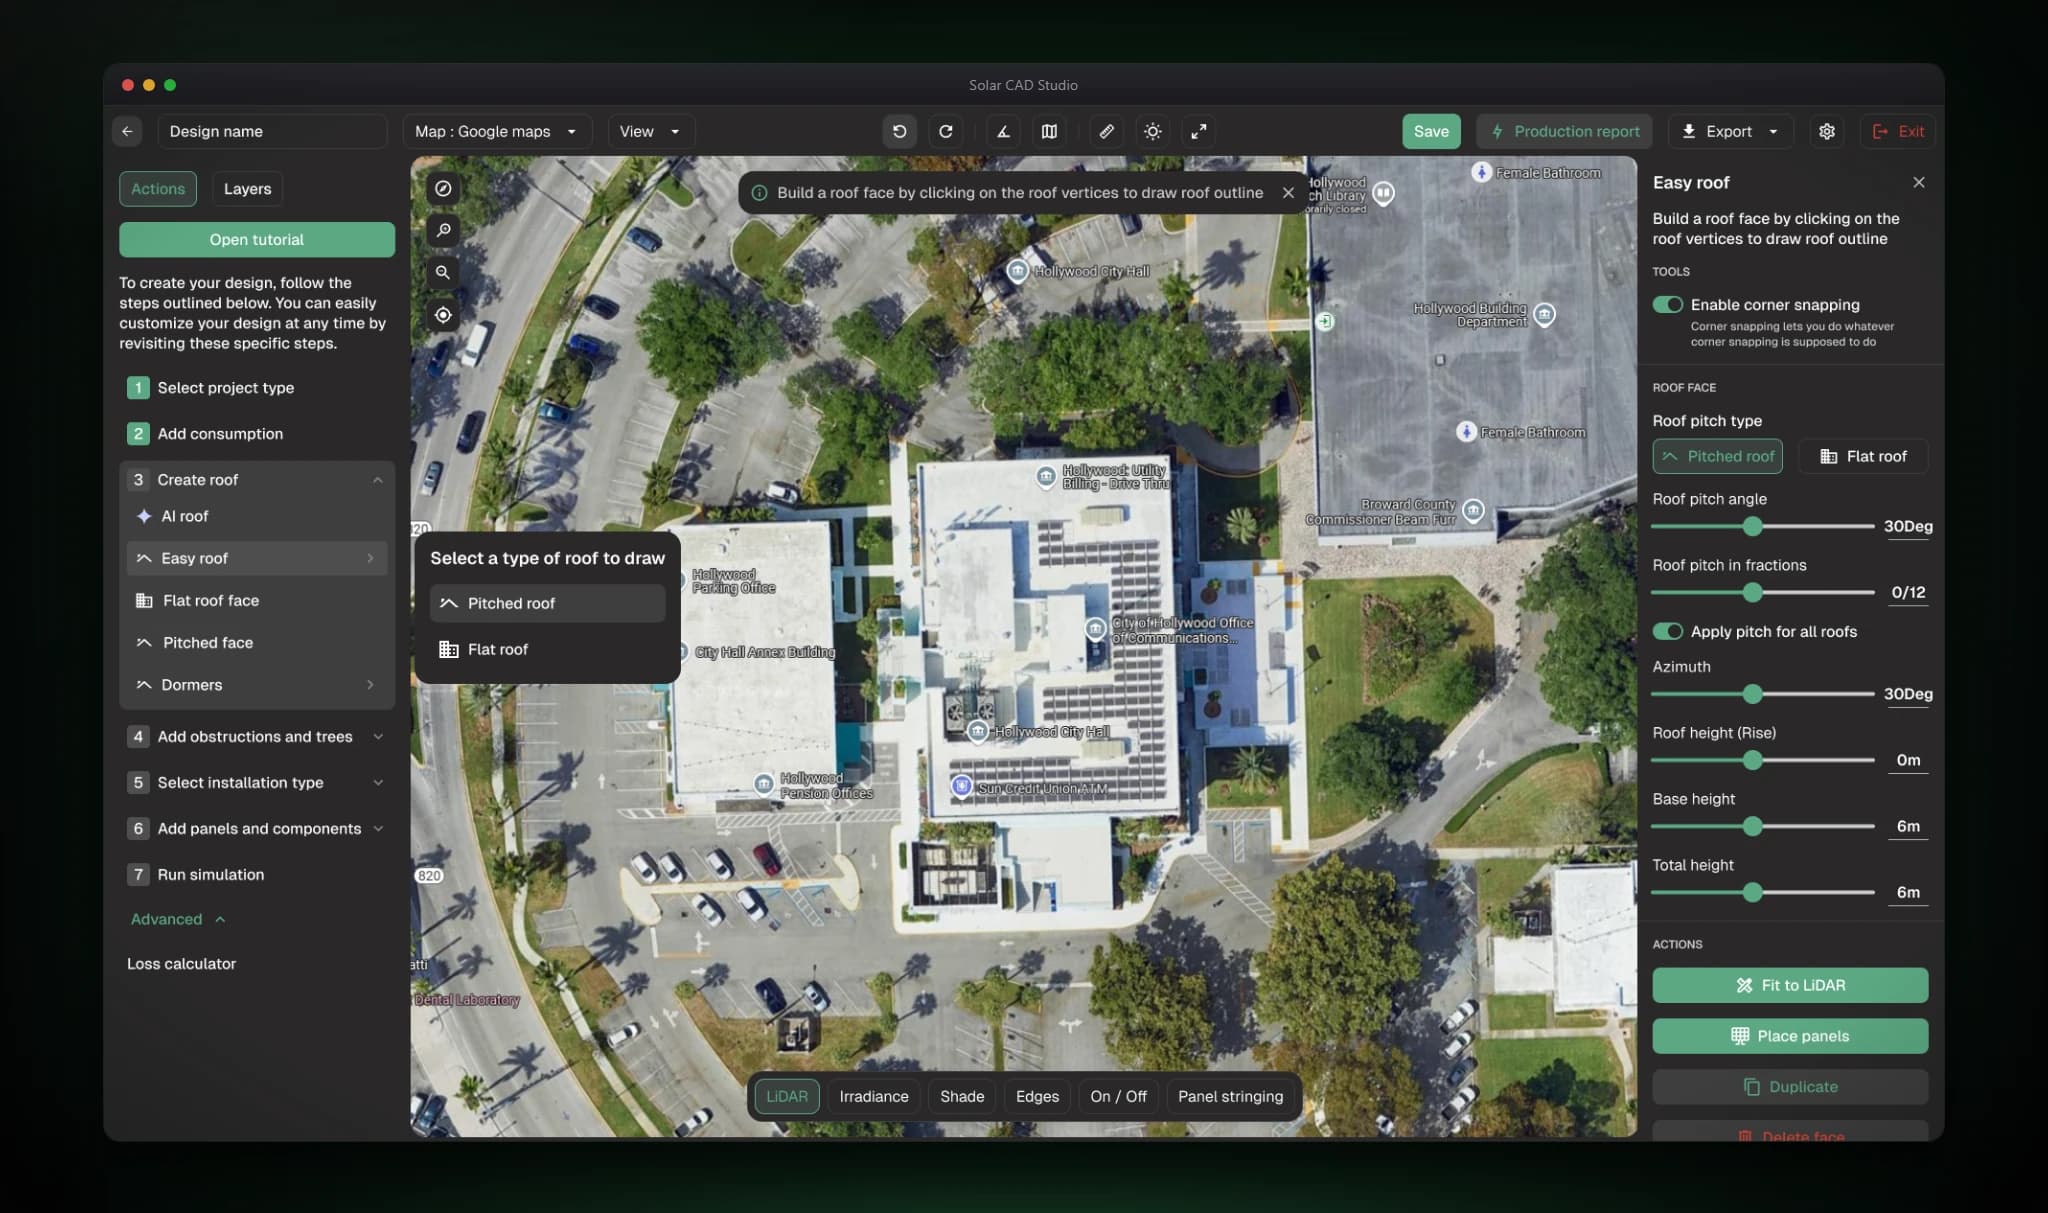
Draw a roof once, then keep every parameter editable.
- The screen
- The left drawer lists the seven workflow steps with Create roof expanded (AI roof, Easy roof, flat and pitched faces, dormers), and a popover asks for pitched or flat. A hint bar explains the active tool. The Easy roof inspector on the right sets corner snapping, pitch type, angle and fraction, azimuth, roof height, and base height, with actions to fit to LiDAR, place panels, duplicate, or delete.
- The problem
- Roof geometry drives every downstream number. Estimators needed to model it quickly, and designers needed to change a slope later without redoing panels, stringing, and production.
- Design decisions
- The drawer keeps the whole workflow visible, so nothing structural is forgotten, and roof creation offers routes for different confidence levels, from AI detection to manual tracing. The inspector changes to match the selected object, keeping parameters beside the canvas instead of in menus. Because editing is parametric, changing pitch or height recalculates the design instead of resetting it.
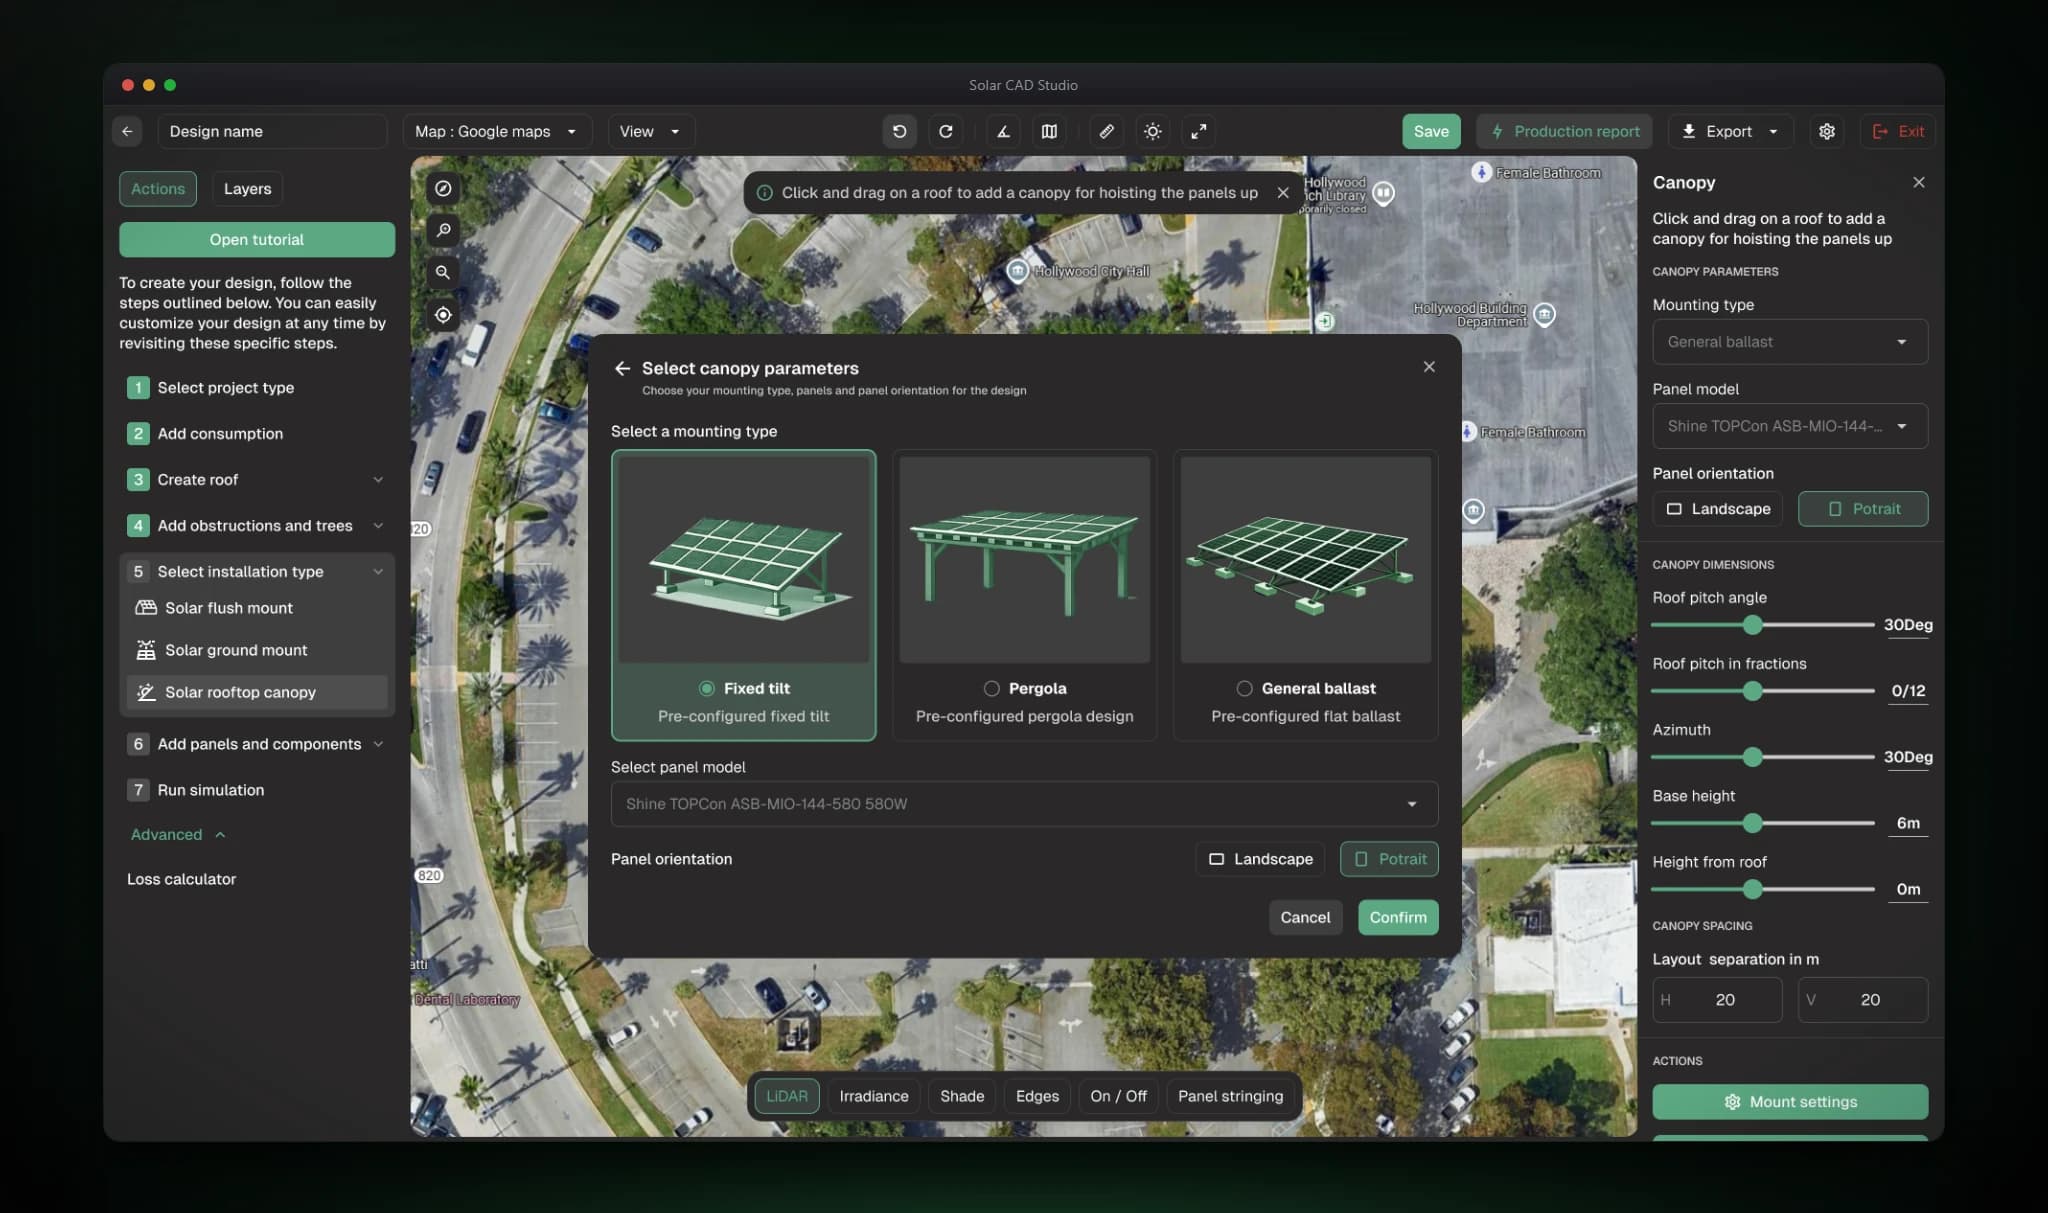
Configure a canopy or array before placing a single panel.
- The screen
- A dialog offers three pre-configured mounting types (fixed tilt, pergola, general ballast) as 3D illustrations, then a panel model selector and Landscape or Portrait orientation. The inspector beside it exposes canopy pitch, azimuth, base height, and row separation, with actions for Mount settings and Place panels.
- The problem
- Commercial canopies and mounting are hard to model in generic solar software, and errors in mounting or spacing surface late, at installation.
- Design decisions
- Mounting types are illustrated pre-configurations, so the choice is fast and visual, and finer control lives one step deeper in Mount settings for bars, poles, foundations, tilt, and row separation. Panel model and orientation are set in the same dialog, so the array is fully specified before placement and one-click placement can follow.
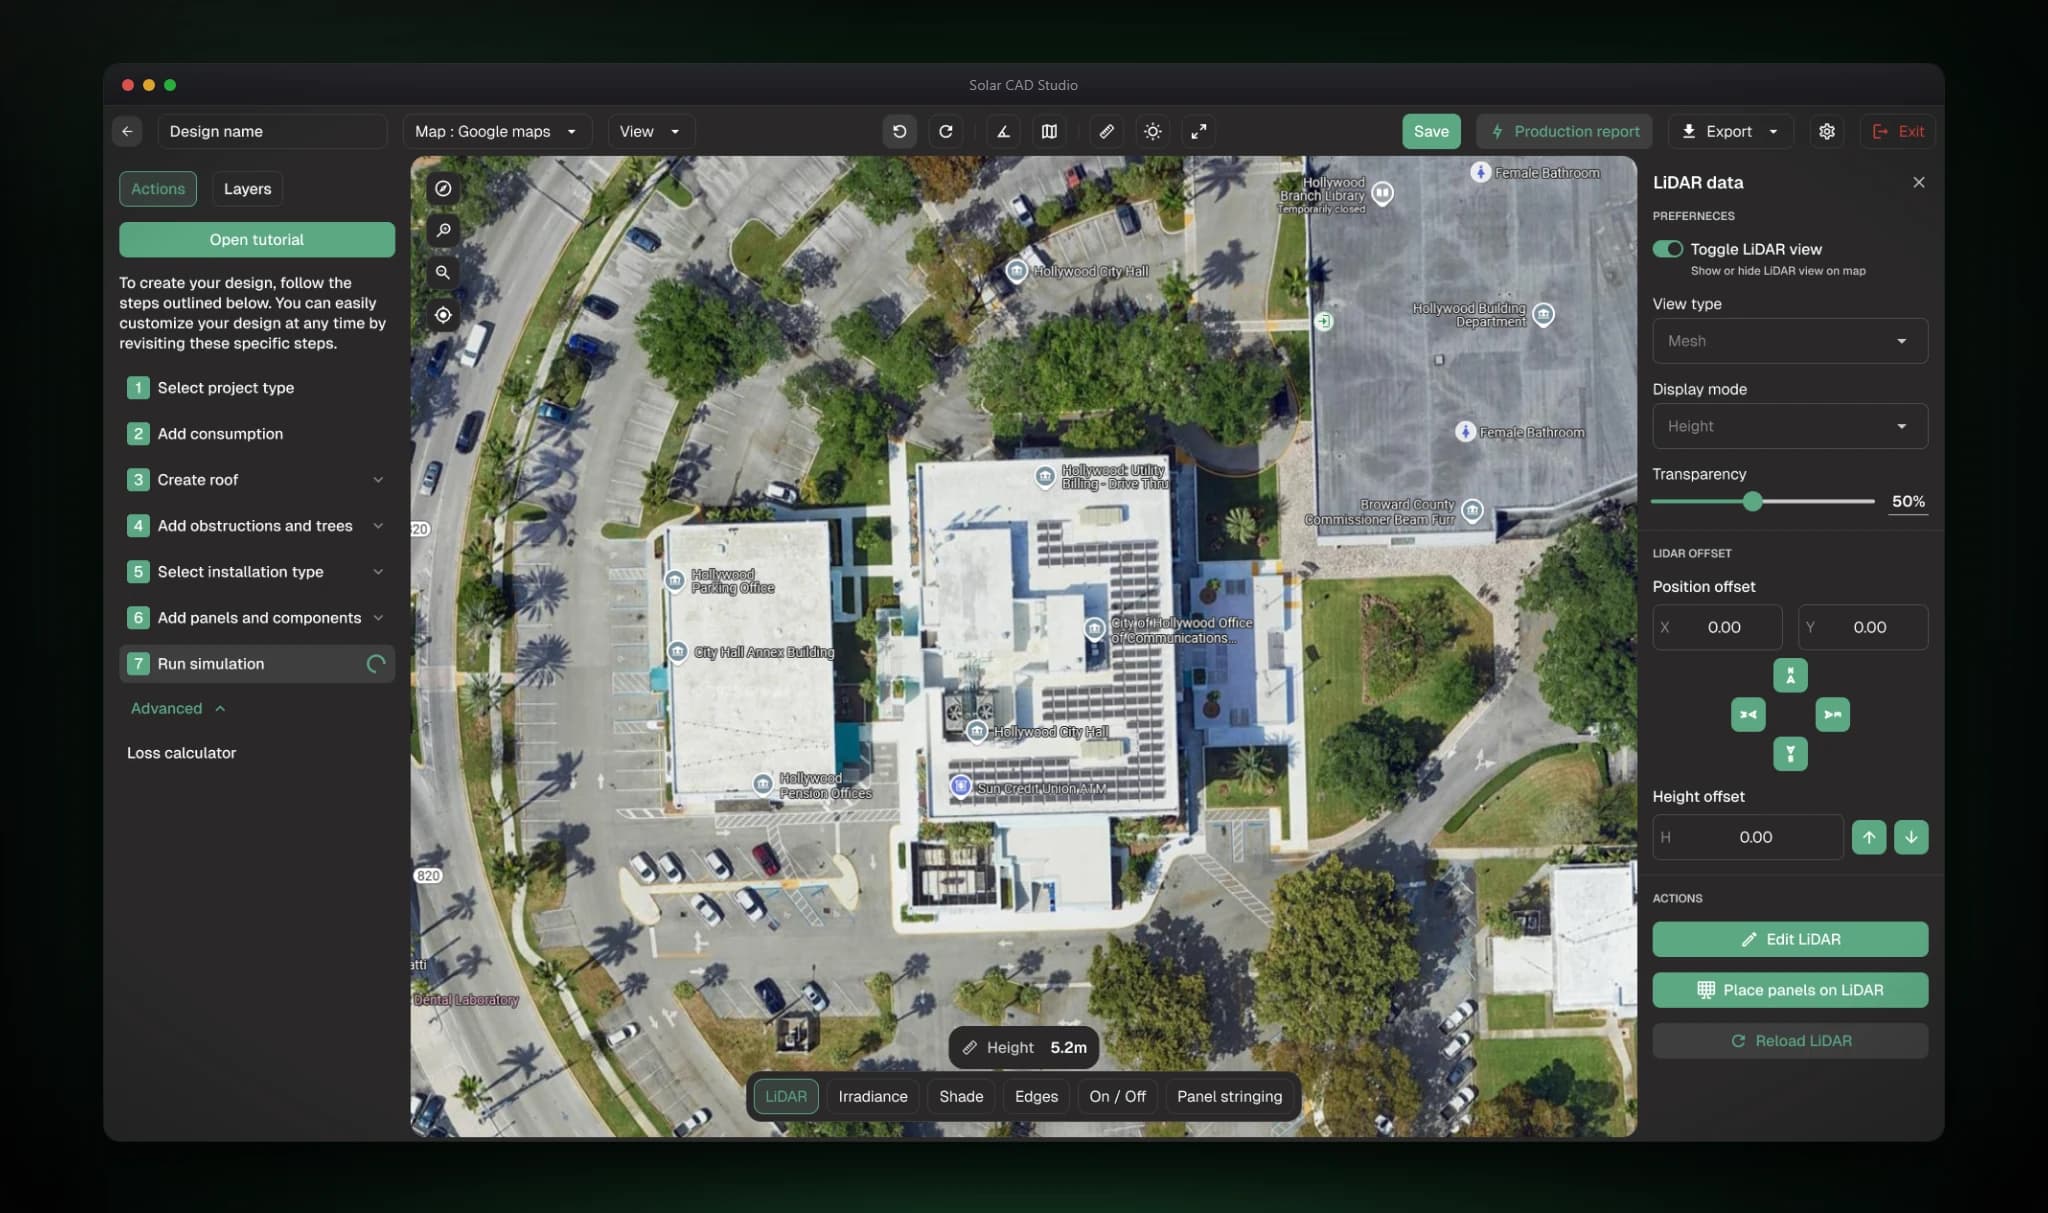
Snap 3D height data onto the aerial imagery.
- The screen
- The LiDAR panel toggles the mesh and sets view type, display mode, and transparency. Position offsets take X and Y values with directional nudges, and a height offset has its own stepper. Edit LiDAR, Place panels on LiDAR, and Reload LiDAR sit below, a live height readout floats on the canvas, and the toolbar shows LiDAR, Irradiance, Shade, Edges, On / Off, and Panel stringing.
- The problem
- Inaccurate roof, tree, or obstruction data overestimates production and causes installation disputes, and LiDAR rarely lines up perfectly with aerial imagery.
- Design decisions
- Every alignment control sits together, so a designer corrects the mesh while watching the canvas. The transparency slider makes mesh-versus-imagery comparison direct, and the height readout gives immediate feedback. The spatial toolbar keeps each analysis mode one click away, a top research priority, and appears on every canvas screen.
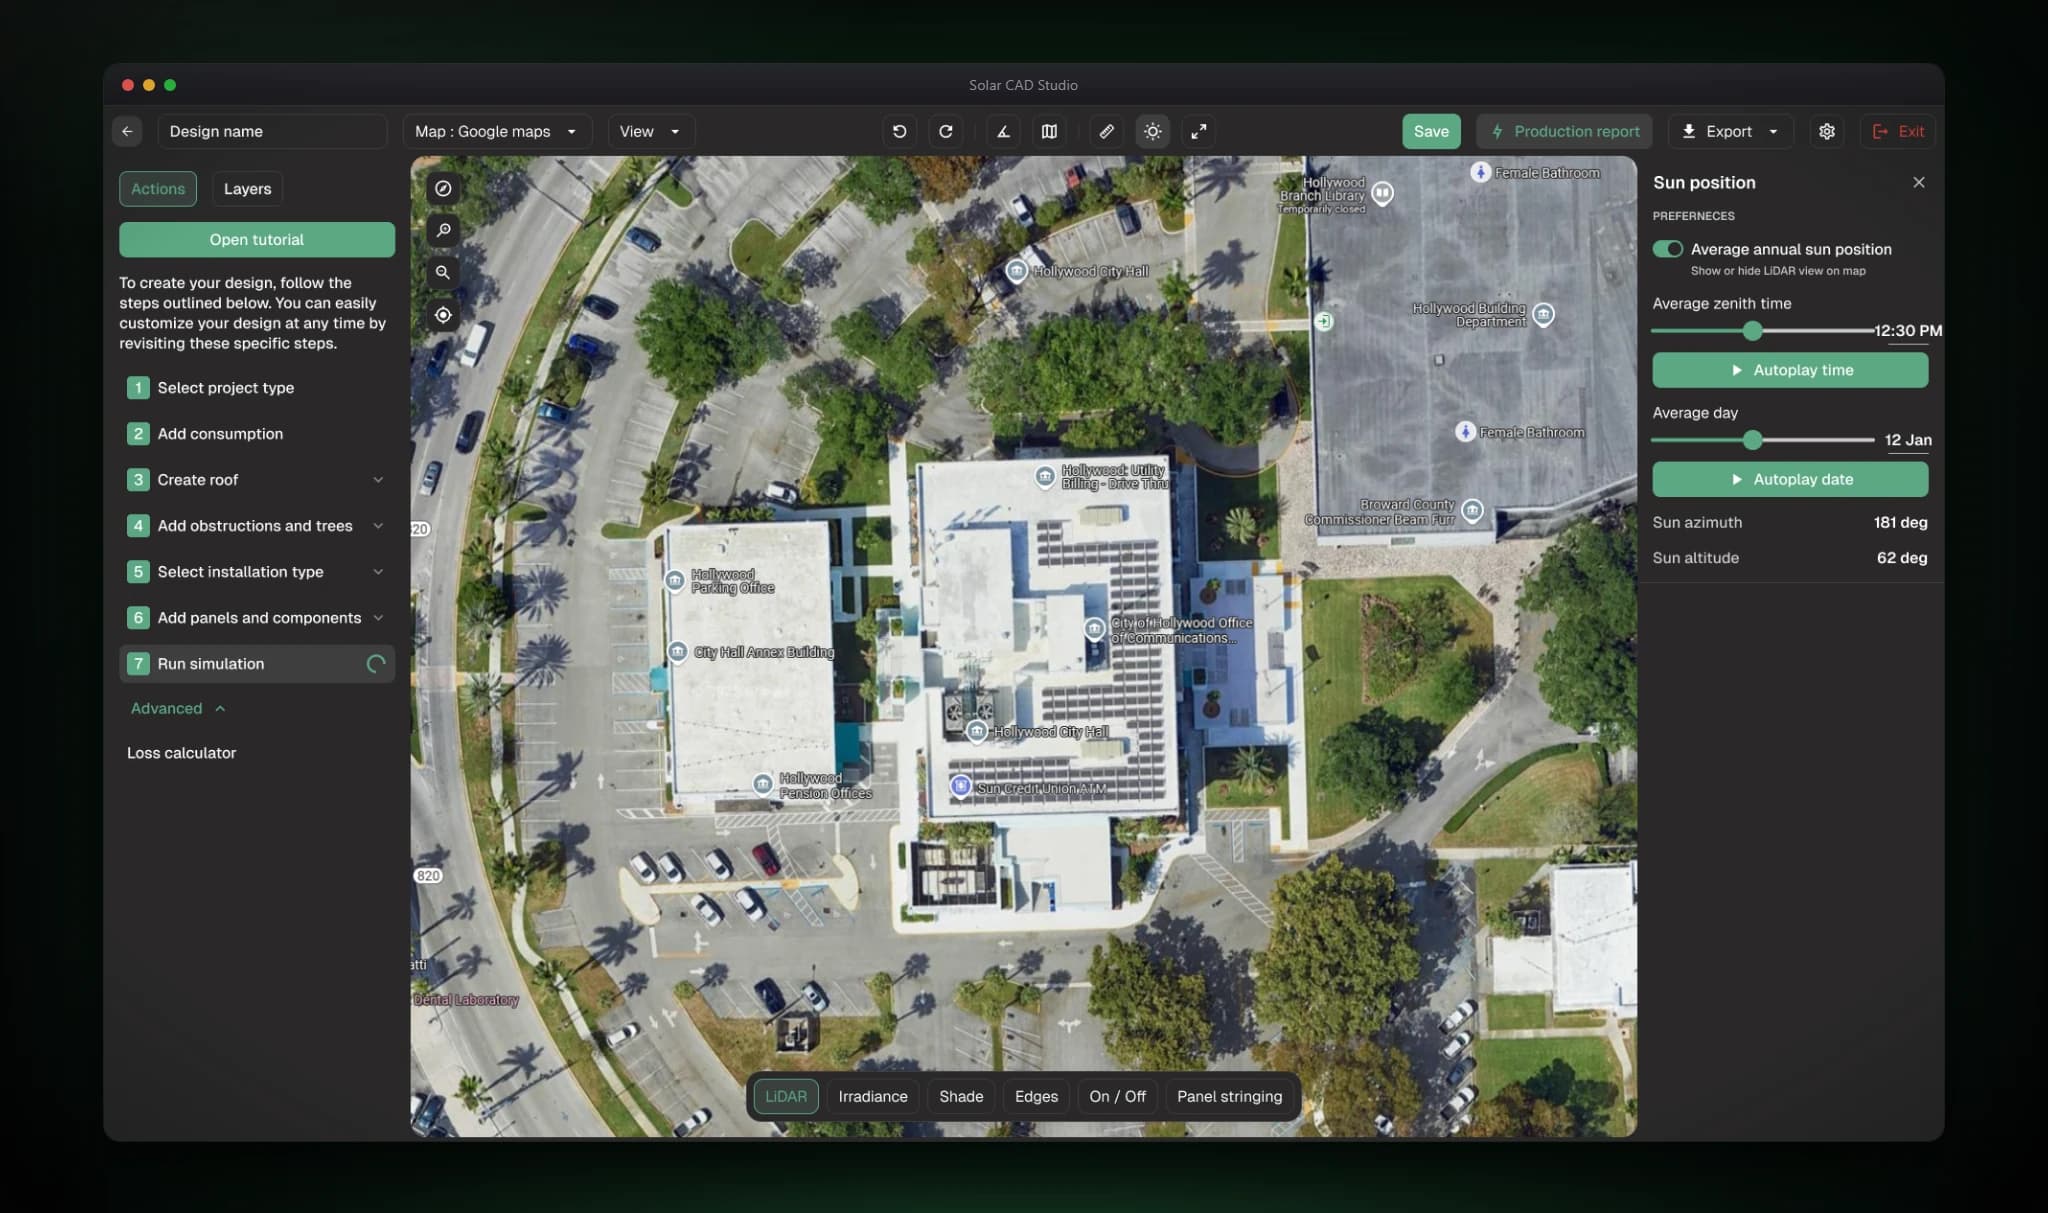
See how shade moves across the day and the year.
- The screen
- The Sun position panel offers a toggle for average annual sun position, a time-of-day slider, and a day-of-year slider, each with its own autoplay. Live azimuth and altitude values sit below.
- The problem
- Without seasonal simulation, teams miss time-of-day and winter shading risks, and production estimates run optimistic.
- Design decisions
- Time and date are separate controls, each animated on its own, so a designer can sweep a day or a year and watch shadows move on the canvas. Numeric azimuth and altitude sit beside the sliders for engineers who need values, not just visuals. The simulator follows the same inspector pattern as every other tool, so it reads as part of the design process rather than a separate report.
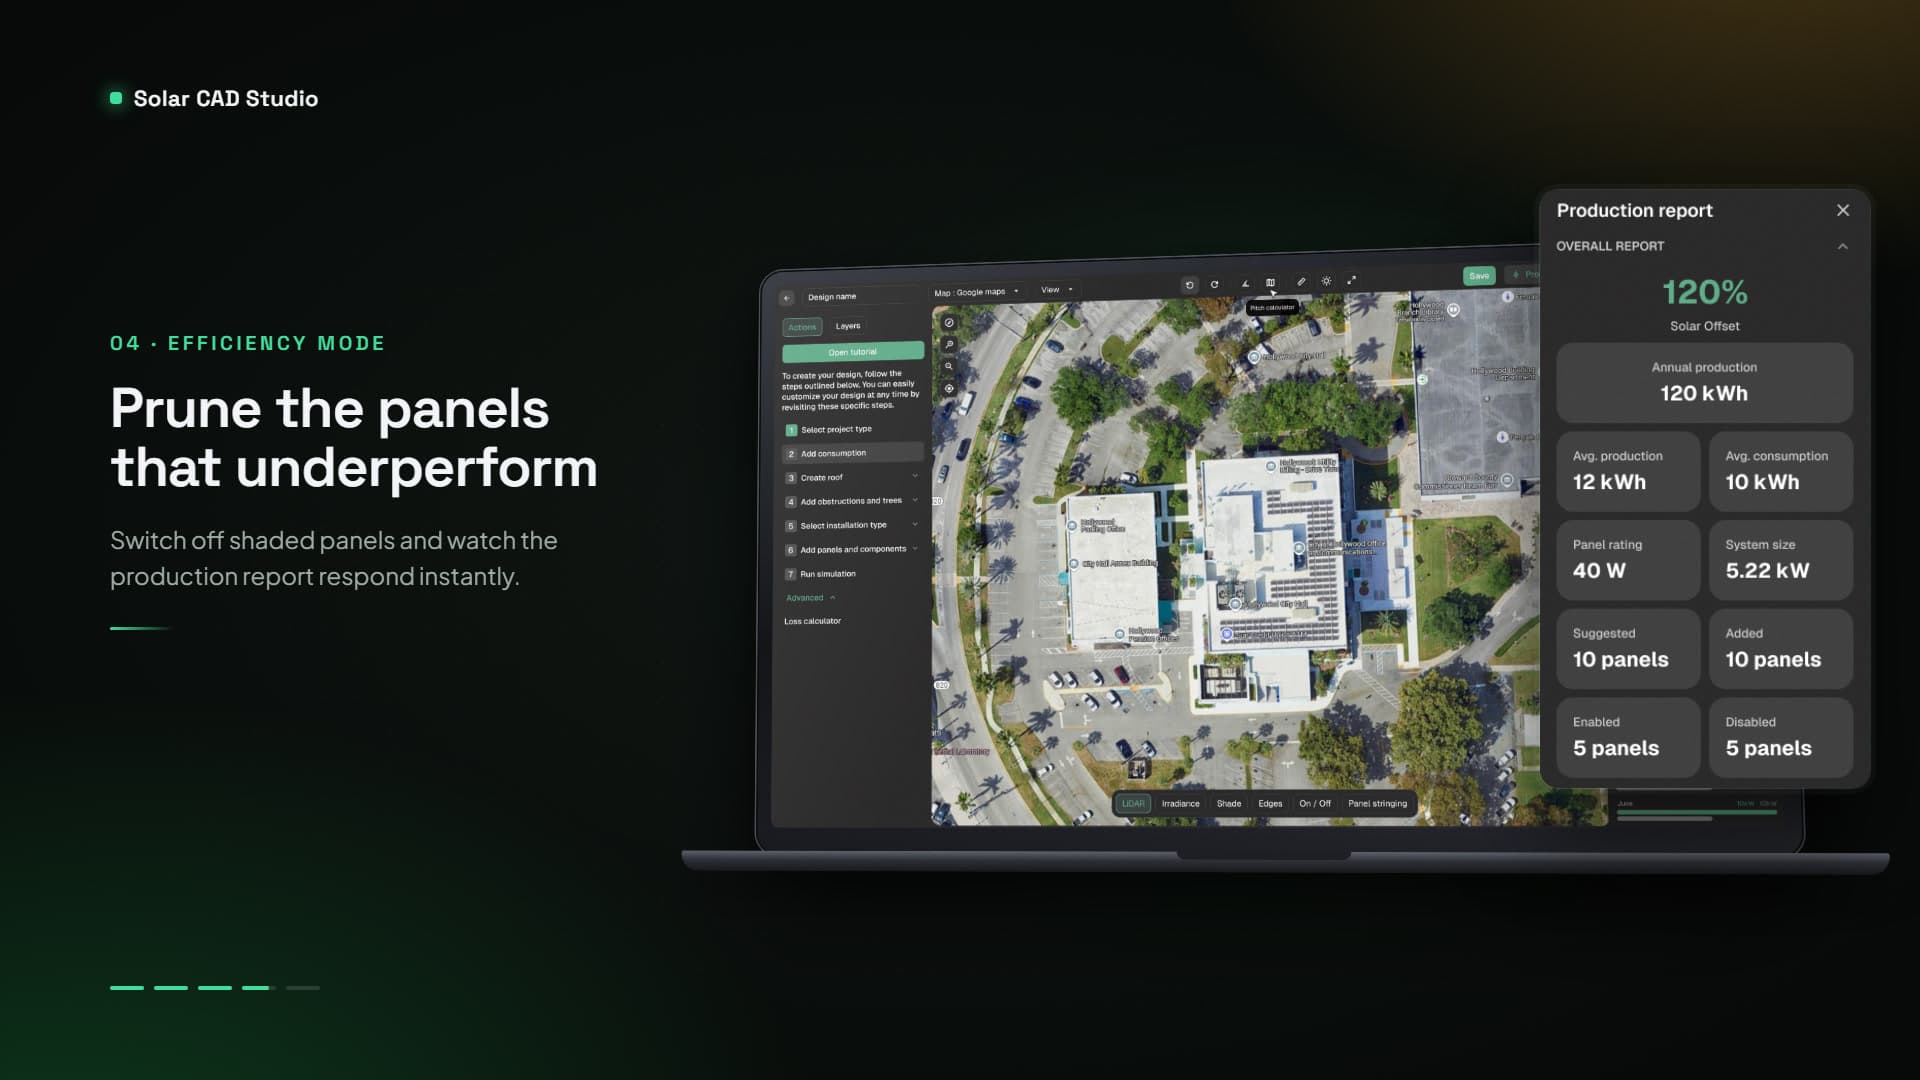
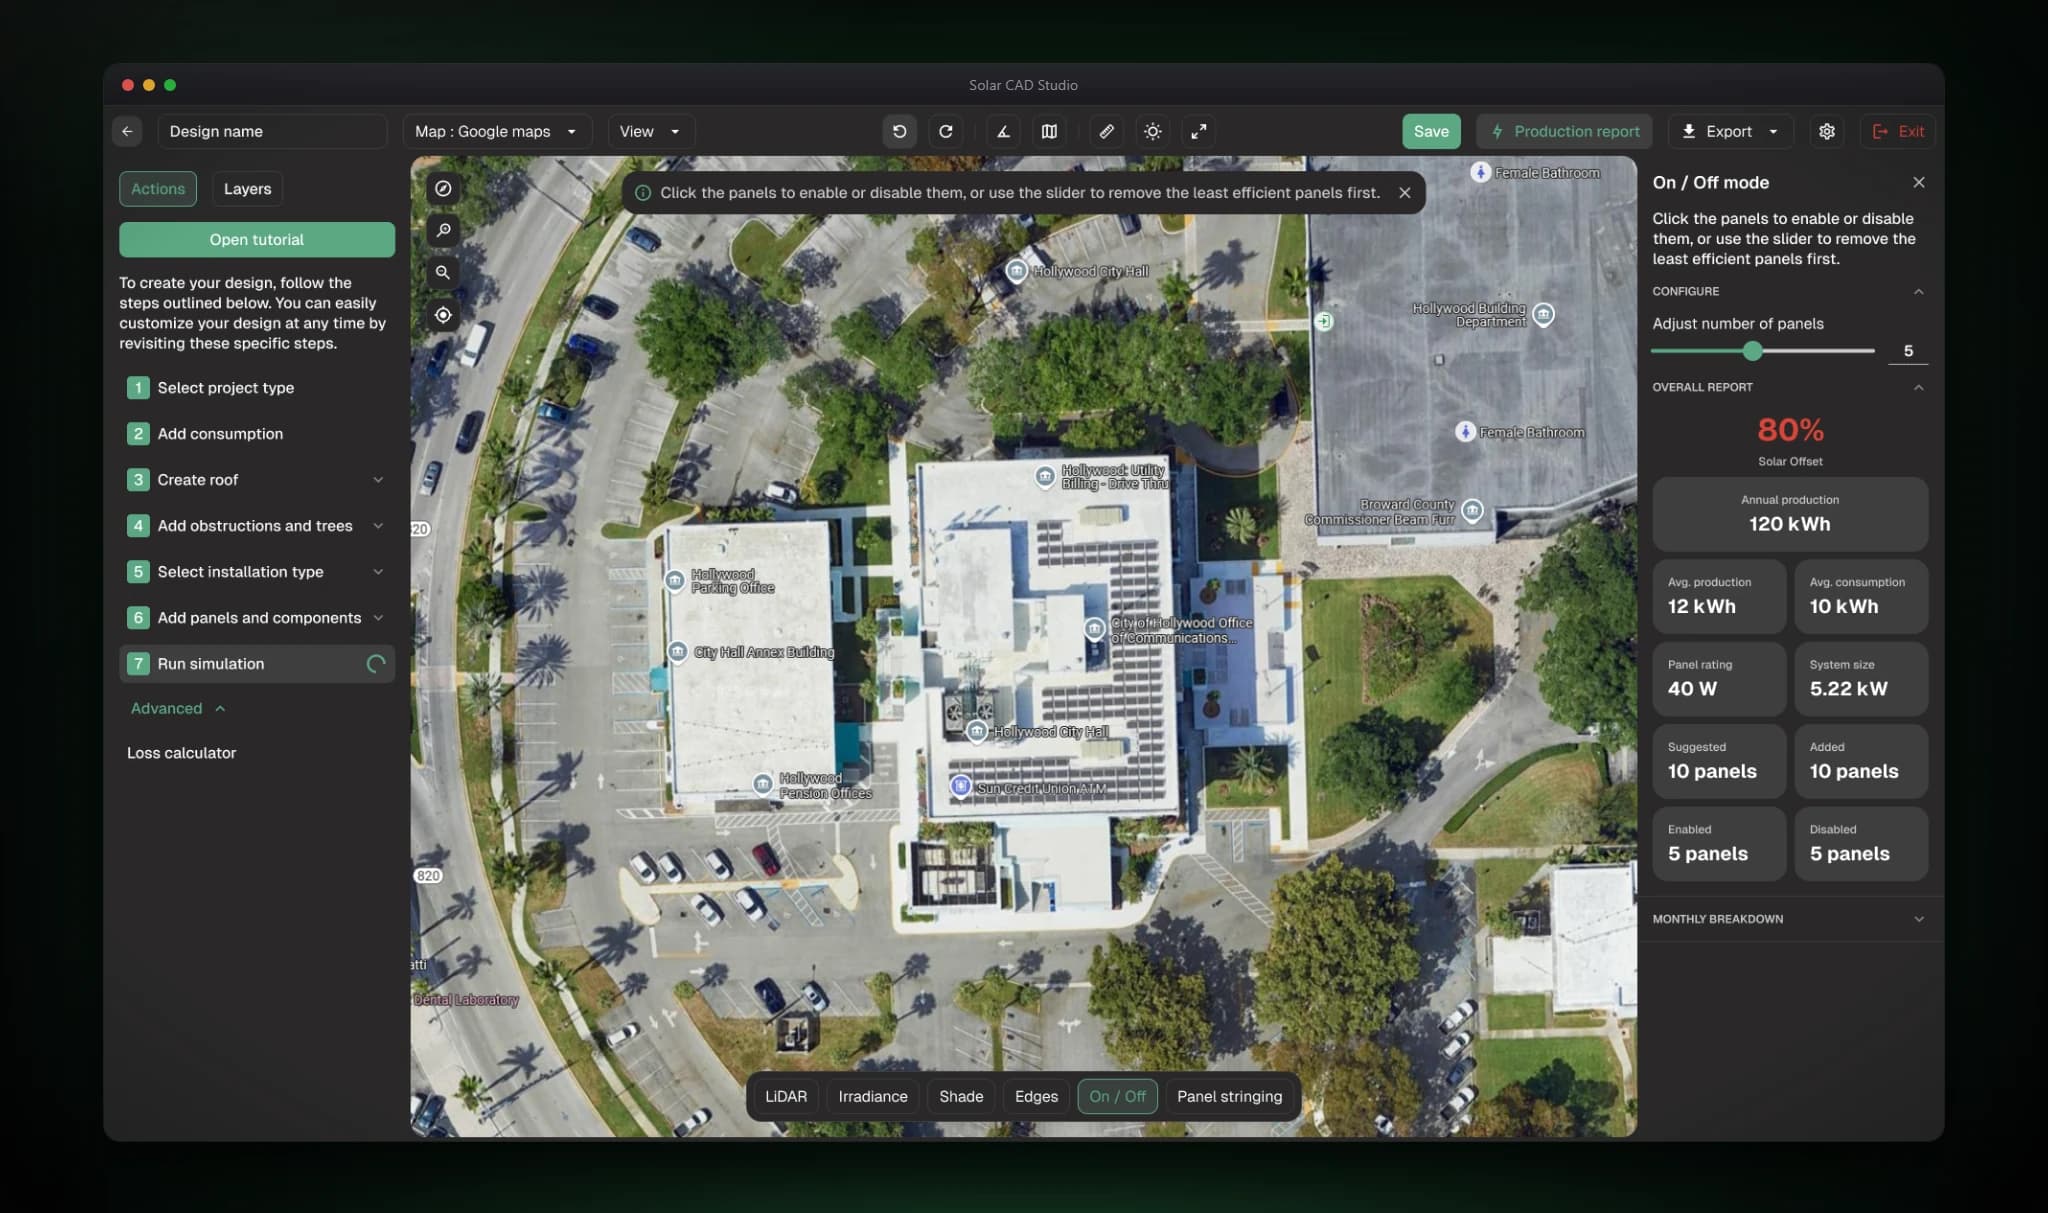
Switch off the weakest panels and watch the offset respond.
- The screen
- On / Off mode lets designers click panels to enable or disable them, or drag a slider to drop the least efficient ones first. The report below updates live with solar offset, annual production, average production and consumption, panel rating, system size, and suggested, added, enabled, and disabled counts, with a monthly breakdown beneath.
- The problem
- Shadowed panels drag down the overall result. Designers needed to see which panels to drop and what that does to the offset.
- Design decisions
- One slider prunes from least to most efficient for a fast answer, and manual clicks handle exceptions. The report sits beside the control and updates immediately, so the tradeoff is visible while it is made. Counts of enabled and disabled panels stay alongside suggested and added ones, so the design remains traceable.
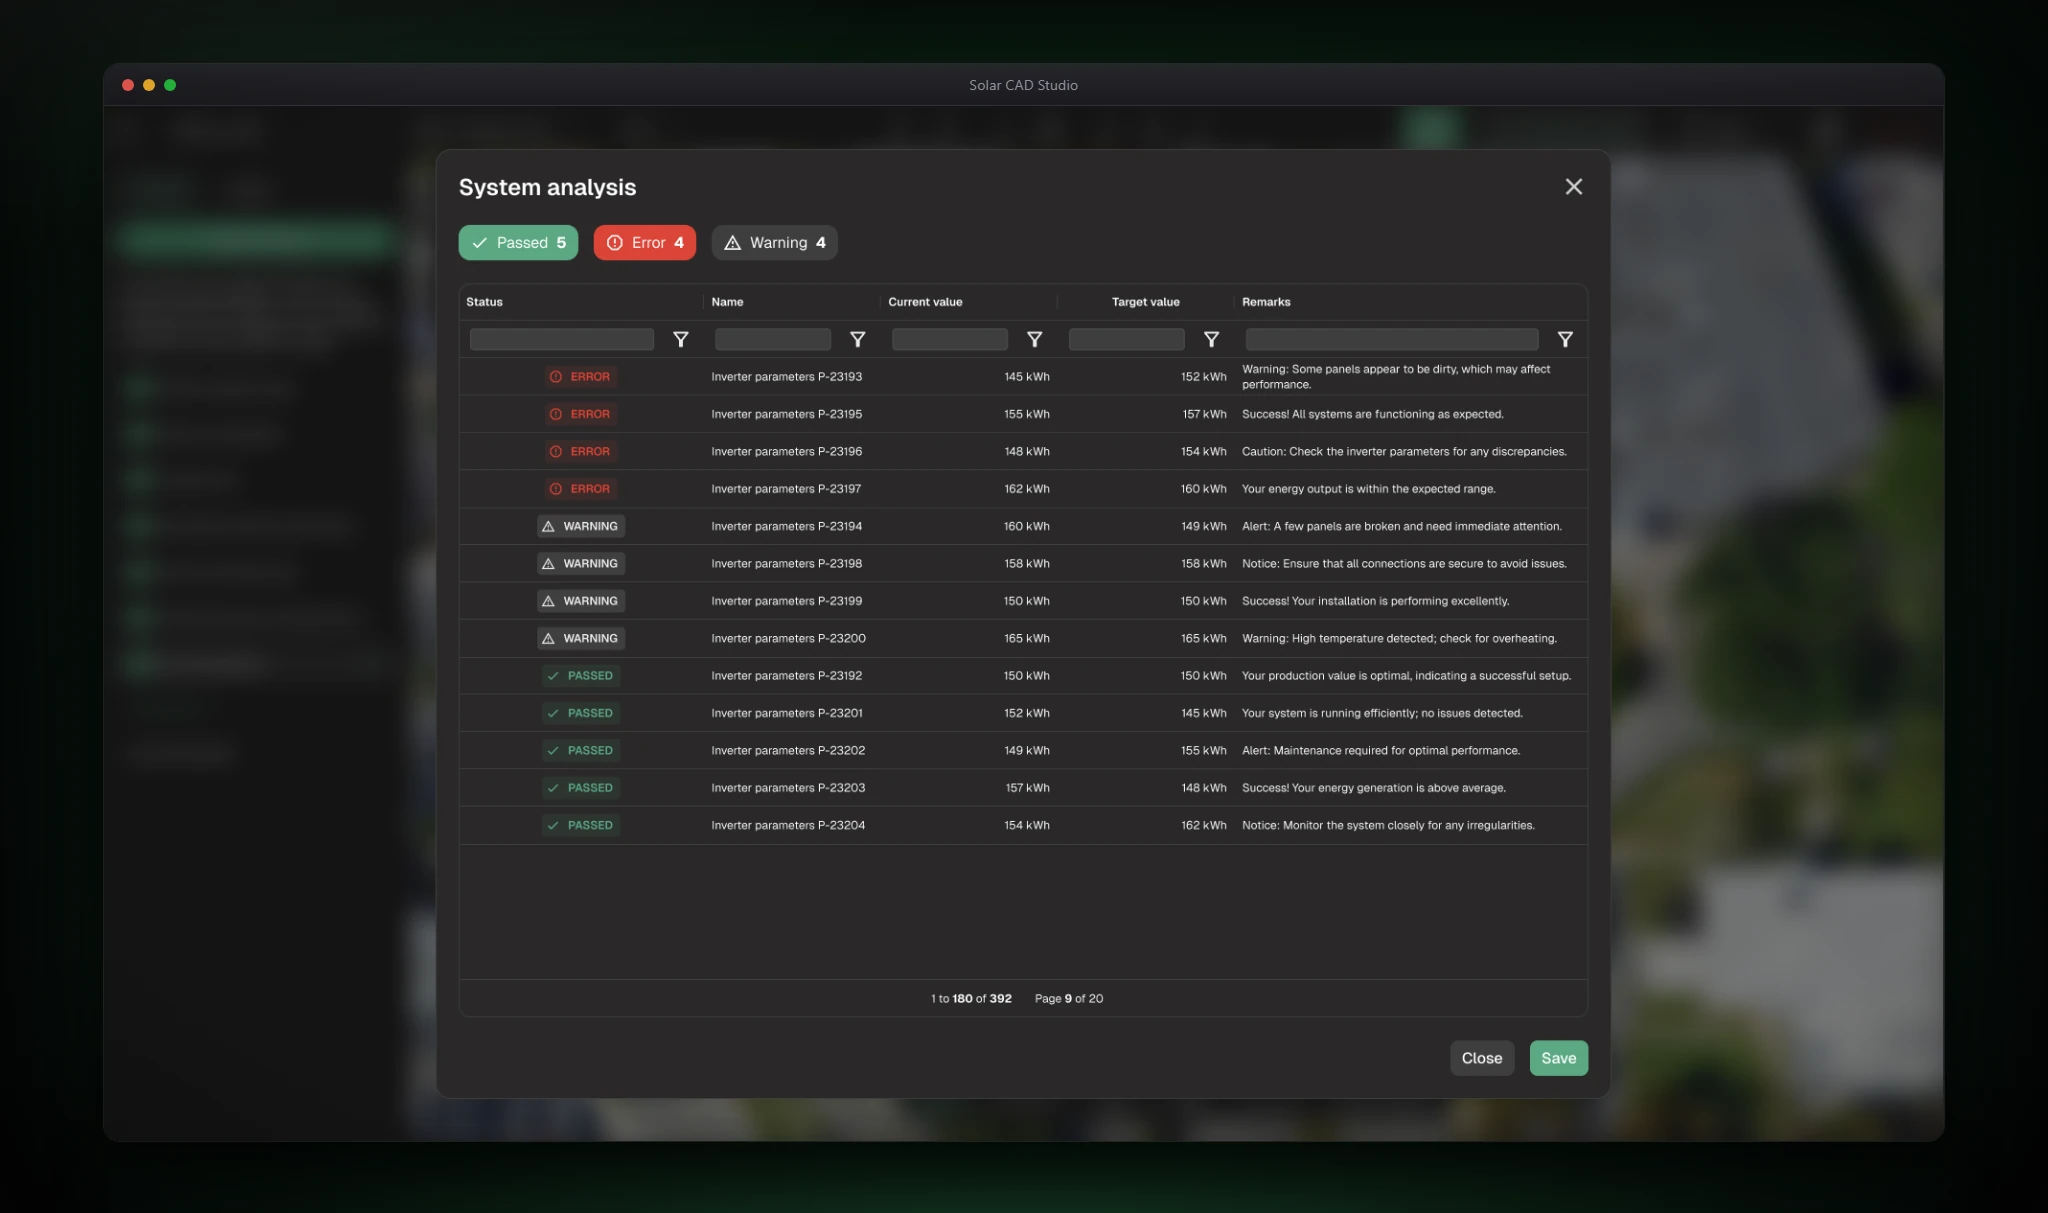
A pre-export check across every electrical and design rule.
- The screen
- System analysis lists each check in a table with status, name, current value, target value, and remarks. Filter chips show Passed, Error, and Warning counts, columns can be filtered, and rows carry red, amber, or green status labels.
- The problem
- Designs move from proposal to permit, and errors found late, such as inverter mismatches or missing inputs, are expensive.
- Design decisions
- Color-coded, filterable status isolates the few errors and warnings from the many passing checks. Showing current against target makes each failure specific, and a remarks column carries the explanation. Running the analysis before export supports the goal of an immediate proposal-to-permit handoff.
Edge cases & logic
LiDAR often misaligns with aerial imagery, so X/Y offsets, elevation, and transparency controls let designers correct it in place. On/Off Efficiency Mode disables low-performing shadowed panels to optimize overall offset. Mount Settings control bars, poles, foundations, tilt, and row separation before placement, which makes canopies tractable. An Edges Report with Auto Calculate Edges resolves uncertain classifications, and the Sun Position Simulator exposes seasonal shading risk.
Reflection & next steps
The lesson: contextual parametric controls beat menu diving. When the inspector updates to match the selected object, designers stay in spatial focus. Next: AI roof and shadow detection for automated multi-pitch tracing and shade-loss prediction, and structural load and wind calculations for code-aware canopies. The studio connects site assessment, engineering-grade modeling, simulation, and permit-ready documentation in one workspace, shortening design time while raising confidence in proposals and installation plans.